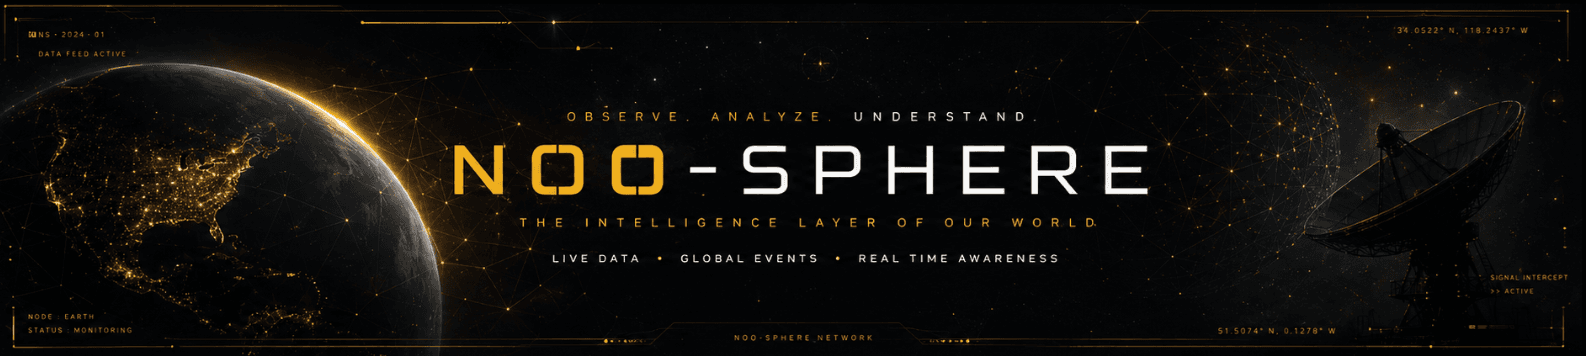
There is a version of this product that costs a hundred million dollars. It would be built by a team of fifty engineers across three time zones, licensed through enterprise contracts to intelligence agencies, hedge funds, and national governments. It would have a 200-page API documentation and a sales cycle measured in quarters.
NOOSPHERE is not that version. It is the version one developer built in six months, alone, using open data sources and a web browser as the delivery mechanism. It is available right now at noo-sphere.live, requires no account, contains no advertisements, and runs entirely in the browser. It is, without exaggeration, one of the most ambitious solo software projects on the public internet in 2026.
The platform is a real-time interactive 3D globe — the planet, rendered in a browser tab, with live data layered on top of it. Earthquakes as they happen, pulled from USGS and rendered as color-coded holographic cards by magnitude. Live flights — two hundred aircraft moving in real time across the sphere, tappable for flight info. The International Space Station tracing its actual orbital path. SpaceX Starlink constellation visible as a mesh of moving lights. Container ships and tankers crossing the world's oceans. Cyberattack arcs animating between countries in real time. Aurora borealis forecasts from NOAA painted across the poles. The position of Mars. The location of the James Webb Space Telescope. And underneath all of it, embedded like a trading floor inside a planetarium: a full asset intelligence terminal with RSI indicators, Bollinger Bands, an economic calendar, on-chain data, a portfolio tracker, and price alerts.
Bloomberg Terminal has a terminal aesthetic and a terminal price. NOOSPHERE has a better aesthetic and costs nothing. That asymmetry is the whole point.
## What NOOSPHERE actually is
The product is easier to understand in use than in description. Open a browser tab. The globe appears — Earth, rendered in three dimensions, rotating slowly. You can spin it with a mouse or a finger. You can zoom to any continent, any coastline, any city. Data layers toggle from a panel on the left.
Turn on earthquakes: every seismic event from the last 24 hours appears as a pulsing node, colored from green through yellow and orange to deep red. Click any node and a holographic card opens with magnitude, depth, time, and USGS event ID. The data is live, updating continuously from the USGS real-time feed.
Turn on live flights: two hundred aircraft appear as moving icons, each tracing its actual current position. Click any aircraft and its flight number, origin, destination, altitude, and speed appear. The world, seen from orbit, is unexpectedly busy.
Turn on ISS tracking: a single point of light moves across the globe at the correct speed along the correct orbital track, its position calculated from real Two-Line Element (TLE) data — the same orbital mechanics data used by aerospace agencies. The station travels at 28,000 kilometres per hour. Watching it cross the Pacific in real time is genuinely arresting.
Add Starlink: the SpaceX constellation appears — hundreds of satellites distributed across low Earth orbit, each moving, each in its correct position. The density of the network becomes immediately visible in a way that no table of statistics conveys.
This is the core of NOOSPHERE: the compression of data that normally lives across dozens of specialized platforms — USGS, FlightAware, NASA, NOAA, financial APIs, news aggregators — into a single interactive surface that anyone can open in a browser tab.
## The data layers, in full
NOOSPHERE runs twenty-plus active data layers, each pulling from a live upstream source.
Earthquakes come from the USGS real-time API — every seismic event worldwide, rendered by magnitude and recency. The holographic card system makes individual events touchable rather than just visible on a map.
Live flights use real ADS-B positioning data. Two hundred aircraft simultaneously is a conservative number constrained by browser performance, not data availability.
ISS and Starlink both use genuine TLE orbital mechanics. The positions are correct — not approximated. The ISS is where it actually is. The Starlink satellites are where they actually are.
Ship traffic draws from maritime AIS data. Container vessels, tankers, and bulk carriers cross the world's oceans in real time. The density of the shipping lanes becomes immediately visible: the English Channel, the Malacca Strait, the approaches to Shanghai.
Cyberattacks are rendered as animated arcs between source and target countries, based on real-time threat intelligence. The volume of attack traffic at any given moment tends to surprise people who see it for the first time.
Nuclear reactors places the world's 440-plus operating nuclear facilities as permanent markers. The geographic distribution — heavy in Europe, the US, and East Asia — is immediately legible.
Aurora borealis uses NOAA geomagnetic activity data to project a probabilistic forecast across the polar regions, updating as solar wind conditions change.
News heatmap aggregates headline volume by country over 24 hours. Clicking a country opens a live feed of local and international headlines from 50-plus countries.
X (Twitter) trends by country, surfaced as a regional overlay with current trending topics per geography.
Market data runs as a persistent ticker: major equity indices, gold, crude oil, and forex pairs, updating continuously.
SpaceX launches maintains a timeline of past and upcoming missions, mapped to their launch sites with payload details and landing outcomes.
Mars position and JWST location are calculated from actual ephemeris data — not approximated positions.
## The asset intelligence terminal
Embedded inside NOOSPHERE, accessible from the main interface, is a tool that has no obvious reason to exist inside a globe platform — and which is, in practice, one of the most-used features.
The asset intelligence terminal is a full trading dashboard: real-time price data for equities, forex, and crypto; RSI and Bollinger Band overlays; an economic calendar with expected and actual values for major macro releases; on-chain metrics including active addresses, transaction volumes, and network hash rates; a portfolio tracker that persists locally in the browser; and price alert notifications that fire as desktop alerts when a threshold is crossed.
For a certain kind of user — the type who has six windows open simultaneously and is watching everything at once — having the globe and the terminal in the same tab is unexpectedly natural. The Bloomberg Terminal costs $24,000 per year per user. NOOSPHERE costs nothing.
## One developer, zero investors
Every data layer in NOOSPHERE has a cost. The real-time APIs — USGS, ADS-B, maritime AIS, NOAA, financial market feeds, news aggregation — all carry usage fees. The server infrastructure costs money every month. None of this is funded by a company, a VC firm, or an advertising network.
The developer — Hakan Yetis, a Turkish software architect who also built Citeley, Menulify, and Sell4.lt — pays the API costs and server bills independently. The platform has no paywall, no premium tier, no data collection, no advertising. It is a public good funded by one person's decision to keep building.
The project took approximately six months to reach its current form. Backend, frontend, orbital mechanics, data pipeline architecture, UI, and the embedded trading terminal — all built by one person. There is a specific kind of software that can only be produced this way: tightly integrated, coherent in aesthetic, uncompromised by committee, and slightly irrational in its ambition. NOOSPHERE is that kind of software.
## Why it matters
The conventional way to access the data NOOSPHERE aggregates is expensive, fragmented, and gated. USGS earthquake data is free but requires knowing where to look. Real-time flight data requires an account with a flight tracking service. Maritime AIS requires a separate subscription. NOAA forecasts are public but raw. Financial data requires a trading platform or a Bloomberg terminal. Space tracking requires NASA's Horizons system or a specialist application.
The total cost of replicating NOOSPHERE's data access through commercial channels, with proper licensing and a polished interface, would run into tens of thousands of dollars annually. The platform makes that irrelevant.
The world is producing more real-time data than at any point in history. Most of it is locked behind enterprise contracts or fragmented across dozens of specialized tools. NOOSPHERE is the argument that it does not have to be.
## The CRT mode
There is one feature of NOOSPHERE that serves no purpose beyond aesthetics and is, for exactly that reason, the one most people mention first.
CRT mode renders the entire interface through a scanline filter — the visual signature of old cathode ray tube monitors, with horizontal line artifacts and a subtle flicker that makes the globe look like it is being viewed on a terminal from 1987. Activating it takes one button press. The world's real-time data, filtered through the visual grammar of Cold War-era command centers.
It is included, as the project documentation acknowledges, simply because it looks good.
## A note on common ownership
NOOSPHERE and Citeley share a founder — Hakan Yetis built both, along with Menulify and Sell4.lt. This profile was written and edited by the Citeley editorial desk because NOOSPHERE belongs in our coverage area, not because the project paid for inclusion. No money was exchanged between the two projects for this article. Read our full methodology and editorial standards.


